Demand Increasing at Slot-Coordinated UK Airports

Anne Correa, mba’s Director of Airline & Airport Services, explores how slot-coordinated airports in the United Kingdom manage their coveted assets and what airlines are willing to do to gain access.

Landing and departure slots are some of the most important assets in the aviation industry. When the demand to land or depart from a specific airport exceeds the infrastructure’s capacity, there is a value in the slots. IATA defines[1] airports with demand greater than supply as Level 3, or slot-coordinated. Exactly who is able to take advantage of the value attached to these slots depends on the jurisdiction in which the slots reside.

Which are the UK’s slot-coordinated airports?

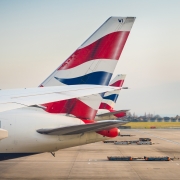
The United Kingdom currently has eight Level 3 airports.[2] London Heathrow (LHR) is the best-known Level 3 airport in the UK, both within the country and the world, because it is one of the largest airports by passengers globally and has operated at full capacity for so long. It comes as no surprise that aircraft movement growth at LHR is 0% over the last three years.  Heathrow simply cannot increase the number of movements with the current infrastructure.  Airlines must increase the size of their aircraft being used at Heathrow or consider alternative airports.  As air traffic growth puts increased pressure on the existing infrastructure, other airports within the region are seeing an increased interest in their slots.

Source: UK Civil Aviation Authority (CAA), OAG Schedules, Airport Coordination Limited (ACL) for FY 2017 (LHR, LGW, MAN, STN, LTN, BHX, LCY, BRS)


How do airlines acquire slots at these slot-coordinated airports?

The traditional way to acquire slots is to go through the slot coordinator, Airport Coordination Limited (ACL), at the IATA slot conferences held twice a year.  At these meetings airlines submit requests for certain times during the season and negotiate with the airport to finalize their schedules.

Alternatively, airlines are increasingly utilizing the secondary market to acquire slots.  The airlines must still formally trade or swap these slots through ACL, but the negotiation can be directly between the respective airlines.  The UK is one of the few countries that currently allow for a secondary market.  In other jurisdictions, if an airline chooses to stop operating a slot, that slot will be returned to the authorities for redistribution.  In the UK, the usage rights of the slot may be passed from one airline to another, at the value agreed upon between the two parties.

Source: Airport Coordination Limited (ACL) as of July 2018

Led by Heathrow, more Level 3 airports are seeing an increase in their slots being traded outside of the bi-annual slot conference.  Since 2008, Heathrow has seen approximately 35 slot trades on average per year.  Slots at Gatwick (LGW) are trading more frequently as airlines have looked for alternatives to Heathrow.  In 2016, we saw the first slot trade at London City (LCY) and in 2017, Luton (LTN) and Stansted (STN) recorded slot trades for the first time.

Some airlines have opted to acquire competition in order to procure additional slots in slot-coordinated airports.  In 2007 easyJet bought GB Airways in part for its Gatwick slots.  International Airlines Group (IAG) acquired British Midland International (BMI) similarly in part for its Heathrow slots in 2012.

Which airlines hold these valuable slots at UK’s Level 3 airports[3]?

Landing and departure slots are some of the most important assets in the aviation industry.  mba expects a demanding road ahead for slot transactions as air traffic growth continues to outpace the available infrastructure in the United Kingdom.

[1] World Slot Guidelines
[2] Bristol Airport (BRS) is Level 3 for night and night shoulder movements 2200 to 0559 UTC from S18.
[3] Full year 2017 data for American Airlines, AerLingus, Blue Air, BMI Regional, British Airways, CityJet, EasyJet, Eurowings, flybe, Jet2.com, KLM, Lufthansa, Luxair, Monarch, Norwegian, Pegasus Airlines, Ryanair, SWISS, Thompson Airways, Virgin Atlantic, Wizz;

Source: OAG (Monarch data included for accuracy however the airline went bankrupt in October 2017)

2018 Farnborough Airshow Results

The 2018 Farnborough Airshow generated impressive results for the commercial sector as both major manufacturers Boeing and Airbus announced a healthy number of new orders and commitments. At the end of the week, Boeing has a slight edge over Airbus with a total of 673 orders and commitments compared with Airbus’ 431. While both the aviation rivals had their share of successes at Farnborough, they will continue to face challenges to keep up with market demand, including engine productivity and overlying trade wars between the United States and China.

An Aviation Rivalry in Flux

Ten years ago, Airbus and Boeing were regularly neck and neck when it came to the backlog of firm orders. However, for the last five years, Airbus has managed to receive more firm orders than its rival, with an aircraft backlog reaching a surplus of 7,000 compared with Boeing’s 6,000 aircraft backlog, at the end of last year. Despite having the backlog advantage, Boeing is slowly increasing its numbers and threatening to bump Airbus from the leading backlog position.

With high hopes for the future, both manufacturers have stated that they intend to reach a set monthly production rate for their leading narrowbody aircraft by the end of next year. Airbus hopes for 63 aircraft monthly for their A320 Family, while Boeing plans to produce 57 per month for their 737. The planned increase in output was announced after both companies recognized the necessity for higher production rates in order to avoid losing their current orders. The biggest challenge for both entities will be making sure the engine manufacturers are able to fulfill their own production goals. Through all of this, the influx of orders and commitments prove that the market is still craving narrowbody aircraft, just as long as Boeing and Airbus can keep up with the demand.

Farnborough Orders & Results

Airbus began the week leading up to the Farnborough Airshow with a year to date total of 321 orders. Before the week closed, the European manufacturer added 93 firm orders and 338 memorandums of understanding (MoUs), increasing total orders and commitments to 431; by comparison, 105 more than the Paris Air Show the previous year. Forty-two of the commitments are for both models of the new A330neo. Another notable agreement came from JetBlue Founder, David Neeleman, who also signed an MoU for 60 A220-300s which he plans to add to a new U.S. carrier. Neeleman’s agreement came shortly after JetBlue placed the exact same order. Through the success of orders flowing in, Airbus Chief Commercial Officer Eric Schulz believes the results show a “strong market appetite for all [their] leading aircraft product families…” covering all models except for their A380, which Schulz believes is now breaking into the second-hand market.

While Airbus had a strong showing in Farnborough this year, Boeing’s time at the airshow was also well spent. Coming in with year to date orders reaching 460 aircraft, they wrapped up their week with a total of 673 orders and commitments, which was 242 more than their main competitor and 102 more than their own numbers at the Paris Air Show in 2017. Seventy-three of those orders and commitments were for their freighter aircraft. These total results cash in at $100 billion, $2.1 billion of which is dedicated to commercial and defense services, while the remaining account is for commercial aircraft. The success of the week, according to Boeing, shows “resurgence in demand for freighters and strong order activity for the 737 MAX and 787 passenger airlines.” Two new customers signed on for the MAX 10 and the 787 alone will soon reach more than 1,400 orders once the commitments from this air show are solidified.


Source: Cargo Facts

Evidence of Trade War Impact

An important item to note as the 2018 Farnborough Airshow came to a close is that of the total 1,104 orders and commitments, just over 29% of them were placed by unidentified customers. The first two days alone saw undisclosed customers signing for 180 A320neo Family aircraft, starting the show off on a high note for Airbus. According to Cargo Facts, it is believed that a good portion of those orders were placed by Chinese companies intentionally to mask their moves due to the growing trade war between their country and the United States.

The trade war began after the US tariffed $34 billion worth of items from China, with the looming threat of $500 billion in tariffs. Firing back, China placed tariffs aimed at specific regions throughout the States, especially hitting the Midwest. According to the Washington Post, the country at risk for more economic loss is China, as 20% of their exports are sent to the US. However, China has the ability to withstand more in the coming year due to their political system having an immensely different chain of command compared to the US. This ongoing trade war seems to be the primary reason for an uptick in unidentified customers at the Farnborough Airshow.

The implications of this trade war threaten the aviation industry in the States as well. For example, the 25% tariff on aircraft weighing anywhere between 33,000-99,000lbs greatly affects Boeing’s 737s, which is the most common aircraft in that spectrum. Additionally, 20% of Boeing’s order book is comprised of orders from Chinese organizations, which is where the anonymity of this year’s airshow comes into play. If the trade war continues, the industry could see a noticeable hit to aircraft manufacturer’s profitability, particularly in Boeing’s case.

Future Outlook

Overall, the increase in orders and commitments at this year’s Farnborough Airshow demonstrates the strength of the manufacturers and the positive outlook organizations have for the coming years. While Airbus and Boeing both had strong showings at the event to increase their aircraft backlog, their potential to reach their own productivity goals and fulfill orders remains tied to the engine manufacturers’ ability to meet the demand. Lastly, both organizations must look to overcome the market challenges presented by the US-China trade war.

Grounding the Trent 1000 Powered 787 Dreamliner

787 Trent 1000 Groundings to Increase

With the summer holidays approaching, airline customers of Rolls-Royce’s Trent 1000 engines have expressed their concern with the downing of the 787 aircraft, and now are requesting lease agreements for other aircraft to fill in their gaps. These requests are effectively putting additional pressure onto Rolls-Royce to speed up the process of completing a permanent fix to the problem.

The issue is housed in the Package C variant of the Trent 1000 engine, which came into service first attached to the 787-9 aircraft, with about 380 in use to date. Thus far, 80% of the variant have been put through basic checks for forms of cracking or other signs of deterioration on the intermediate pressure compressor blades. From that 80%, a third of the engines have failed the first round of inspections, under requirements placed by regulators for aircraft who travel more than 2 hours and 20 minutes from the nearest airport they can divert to in case of emergency. Those engines that have failed have been removed from the aircraft so that they can be repaired, a fix that Rolls-Royce has already fitted onto a test engine set to fly in June and hope to be implemented throughout their customer base prior to the previously announced release of early next year.

The current amount of grounded 787 aircraft has reached 30, but that number is now believed to rise to around 50 aircraft, as more enter into inspection. According to the CEO of AerCap Holdings Aengus Kelly, “Now, if the blade fails the inspection, then the engines come off wing, go into the shop… The problem at the moment is that there are not enough spare engines… [and] a number of [the downed 787 aircraft] are our airplanes.” This concern is one of many voiced, and to help expedite the process of implementation of the permanent fix, Boeing has sent an executive to watch over the problem solving among different locations that manufacture the engine, and are currently working on the widespread issue.

787 aircraft with the Package C variant were all produced and delivered before the end of November 2017, upon which time delivery stopped for that specific engine type. The engine variant that took over after the Package C is the Trent 1000 TEN, which was first seen in commercial service on November 23, 2017. Found on mba’s STAR Fleet, the operators with the most active 787s employing the Package C variant Trent 1000 engine include All Nippon Airways (52), British Airways (24), LATAM Chile (21), and Norwegian Air Shuttle (20). Of the 21 that LATAM Chile operates, 11 of the aircraft are grounded due to the compressor blade issue.

According to Rolls-Royce’s President of Civil Aerospace, “we fully recognize the unacceptable levels of disruption our customers are facing… [and] while we expect the number of aircraft affected to rise in the short term as the deadline for the completion of initial inspections approaches, we are confident that we have the right building blocks in place to tackle the additional workload.” However, with the increased inspections, they believe it won’t have additional financial impact on the company, as they are set to reveal their newest restructuring plan on June 15th.

Sources:

Aircraft Value Update and Insights for 2Q 2018

What’s Driving Values in 2Q 2018?

REDBOOK’s ISTAT Certified Appraisal Team Has the Latest:

Relying upon the current market conditions and the aircraft transactions that have occurred over the first quarter and into the second quarter of 2018, mba has updated and released the 2Q 2018 values on REDBOOK. Below you’ll find the highlights from the update and a look into the most highly traded aircraft of the year.

For a look into current and historical data of the entire global aircraft fleet, mba launched STAR Fleet (System Tracking Aircraft Repository) within the REDBOOK platform.

New Additions to REDBOOK

  • 32 new engine variants and types have been added to REDBOOK including the Trent 1000, GEnx-1B64 and -1B70, and the -5Bs and -7Bs with tech insertion.

Aircraft

  • Mid-vintage A320-200 market adjustment factors increased up to 4% for some years including early 2000 builds. Demand for current generation aircraft remains high due to low fuel prices and neo delays.
  • A350-900 and 787-9 Market Values see market increase of 1% above base as operator and lessor appetite remain strong.
  • A320neo and 737 MAX family aircraft continue to see Market Values equal to Base, though Market Lease Rates are trending below the 0.8% lease rate factors historically achieved by new aircraft, averaging closer to the mid-0.6% lease rate range.

Engines

  • PW4060s saw a boost of 2% over the quarter mainly due to the demand from 747-400Fs and 767-300Fs boosting need for spare engines and parts. Values are expected to climb in the short term.

For more updates on the 2Q 2018 Aircraft Market. Please note, non-REDBOOK subscribers will have limited access.

mba’s STAR Fleet Analyzes Aviation in Japan

Japan Aviation Market Snapshot

Powered by mba’s REDBOOK STAR Fleet

Leading up to the 7th Annual Japan Airfinance Conference, mba generated a brief analysis of the Aviation Market in Japan using data from REDBOOK’s recently launched STAR Fleet.

Here are some of the insights derived from the report:

  • Currently 717 aircraft are operated by Japanese carriers
  • 21% of aircraft operated in Japan are leased
  • 62% of the country’s fleet is operated by the top two carriers
  • In 2017, there were 1,101K frequencies and 201.4M seats (each way) recorded in Japan

China’s Trump Card: The C919

The COMAC C919

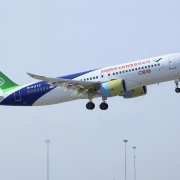
China has long been recognized as an engine for growth in the aviation industry.  Its airlines are rapidly expanding and demand for air travel continues to skyrocket, for both domestic and international trips.  Not wanting to cede the entirety of the increased demand for aircraft to Airbus and Boeing, the Chinese Government launched The Commercial Aircraft Corporation of China (COMAC) in 2008.  COMAC has since launched the C919, a 168 seat aircraft which looks to break the Airbus and Boeing duopoly.  The Chinese are not the first to attempt to break into the narrowbody passenger aircraft market.  Some have been successful, like Airbus with the launch of the A320 in the late 1980s, while others have failed, like the Dassault Mercure in the mid 1970s. While the C919 will likely not reach the heights of the A320, the aircraft has the potential to be carried to moderate success by the domestic Chinese market.

Operating Characteristics

Although the C919 has the performance capabilities to meet the needs of virtually all of China’s domestic carriers, it cannot match its western counterparts particularly in regards to range. The C919 has a max payload range of only 1,350 nautical miles (nm), which is 1,200 nm less than the 737 MAX 8 and 650 nm less than the 737-800. When both aircraft are configured to hold 168 passengers, the C919 can travel 2,430nm, while the 737-800 can travel 3,100 nautical miles, assuming an average passenger weight of 190 pounds (lbs). This range differential is accounted by the C919 having an MTOW of 165,565 lbs, nearly 10,000 lbs lighter than the 737-800, but having an empty weight that is 2,000 lbs heavier than the 737-800.

While the Boeing 737 aircraft may have the range advantage over the C919, an analysis of the schedule of Chinese operators reveals that the C919 is well suited to domestic Chinese operations. mba performed an analysis of all Chinese domestic routes currently operated by the 737-800 or A320-200 and flown at least weekly.  The results showed that the C919 would likely be able to serve all of these routes, assuming the aircraft is operated in its standard 168 seat configuration. Depending on the C919’s take-off performance, the aircraft would likely take a seat penalty at some of China’s higher elevation airports such as Ürümqi. Additionally, the C919 as well as the 737-800 and A320-200 cannot operate in cities such as Lhasa, which has an elevation of over 11,000 ft. Due to these observations, Chinese operators would most likely not be concerned about the C919’s range limitations. COMAC official literature states that the company will launch a C919ER, which will bring the aircraft’s performance closer to that of the 737-800 and increase COMAC’s presence in the market. However, no information has been released regarding the variant’s launch date or how COMAC will achieve the performance upgrade.

The C919’s suitability for Chinese operations is further explained by China’s unique geography for a country of its size. Nearly all of China’s population centers hug its east coast, while the western part of the country is mostly empty, save for a few large cities in the Xinjiang province in the northwest of the country.  There are also several other countries whose geographies are similar to China’s in this regard, which would allow the C919 to operate successfully. Brazil, India, and most countries in South East Asia would all be suitable markets for the aircraft, but major airlines in these regions have substantial orders for A320neos or 737 MAX 8s. This market saturation for narrowbody aircraft makes it unlikely that carriers in these regions will place C919 orders.

Another disadvantage the C919 has versus its western counterparts is that it has a maximum seating capacity of only 174 seats. The 737-800 and A320-200 currently have a maximum seating capacity of 189 seats.  This seating limitation will be less attractive to low-cost carriers, which operate narrowbody aircraft at maximum capacity. The ideal customer profile for the C919 is a Chinese full-service carrier, which is reflected in the type’s order book, from which Chinese low cost carriers Spring Airlines and Lucky Air are notably absent.

Certification

COMAC faces an arduous road attaining type certification for the C919.  It took twelve years for COMAC’s first aircraft, the ARJ21, to attain type certification from the Civil Aviation Administration of China (CAAC). The C919 is expected to attain type certification from CAAC in 2020, which like the ARJ21, will be twelve years after the program’s launch. Another hurdle facing the C919 is type certification by western regulators such as the Federal Aviation Administration (FAA) in the United States and the European Aviation Safety Agency (EASA) in the EU. COMAC has applied with EASA for type certification for the C919, and in November 2017, the Chinese aviation regulator, the Civil Aviation Administration of China (CAAC) signed an agreement with the FAA which grants CAAC “comprehensive peer recognition” as an aerospace supplier.  All Chinese aircraft would still be subject to certification review with the FAA, but the agreement does open the door to further cooperation between the FAA and CAAC in the future.  These developments show that western certification of the C919 is not as far-fetched as believed when the program was launched. However, even if western type certification is received, it does not necessarily mean the aircraft will be purchased by western operators or lessors.

After Market Support

Potentially limited aftermarket support is another issue that may cause many non-Chinese operators to balk at purchasing the C919. It is unlikely that COMAC will be able to develop an efficient maintenance and spare parts distribution network for the aircraft.  Interjet, the sole North American operator of the Russian built Sukhoi Superjet, has had operational difficulties caused by Sukhoi’s similar supply chain issues. Engine maintenance delays have forced the grounding of several of Interjet’s Superjet aircraft, and some of the grounded aircraft are being cannibalized to keep the rest of the fleet flying.  Even though the Superjet’s sole engine option is a western built engine (the French built Safran PowerJet SaM146) the engine’s only application is the Superjet, limiting the amount of spares available. Should non-Chinese operators adopt the C919 they would likely face similar challenges as Interjet.  The C919’s saving grace in this area is that a large portion of the C919’s components are western built.  The APU is a Honeywell HGT750, and its engines, CFM LEAP-1C will likely have significant parts commonality with other CFM LEAP engines. However, this will probably not be enough to convince operators that maintenance can be completed on C919 aircraft in a timely and affordable manner.

New Entrant Competition and Pricing

Even if the C919 had performance figures equivalent to current generation Boeing and Airbus aircraft, it would still have a hard time securing any orders outside of its home market. Operators are often unwilling to be early adopters of an unproven manufacturer’s aircraft as seen in the order book for Russian built Irkut MC-21 and Sukhoi Superjet.  The MC-21 has performance figures much closer to the 737 MAX 8 than does the C919, but it has only managed to secure 205 orders, with Egyptian operator Cairo Aviation being the only customer outside of the Commonwealth of Independent States (CIS). Sukhoi has had similar challenges marketing the Superjet, with only two commercial operators of the aircraft (Mexico’s Interjet and Ireland’s CityJet) located outside of the CIS. Commercial challenges experienced by Russian manufacturers show that there is an uphill battle ahead for COMAC’s marketing team when they attempt to sell the C919 to non-Chinese operators. Granted, once all 205 MC-21 orders are filled, the aircraft will make up roughly 40% of all narrowbody aircraft operating for Russian airlines. Should the C919 achieve similar home market penetration, COMAC will receive around 1,000 orders for the aircraft.

Pricing of the C919 is difficult to pinpoint as no commercial terms have been agreed upon as of December 2017.  All orders currently consist of a “customer agreement” in which pricing and delivery schedules have not been discussed.  List price of the C919 has not been announced by the manufacturer although it is believed to be around $68.4 million.  If the same discount that manufacturers typically give to the A320-200 and 737-800 list prices is applied, the purchase price of a new C919 would be somewhere between $28.7 million and $32.1 million, placing the aircraft at around the same price as a new Embraer E-190. This pricing is a bargain for an aircraft of the C919’s size and the aircraft may win a few customers on price alone.  The Chinese Government is also likely to subsidize the purchase of the C919 for Chinese operators, increasing the likelihood Chinese airlines would select the aircraft over its western competitors.

Tariff Effects

On April 4th 2018, the Chinese government announced a 25% tariff on aircraft imported from the United States of America with an empty weight between 15,000 and 45,000 kilograms.  It is unknown how the Chinese will define empty weight, which is key to assessing the impact of the proposed tariff. The 737 MAX 8 has an operating empty weight of 45,070 kilograms, which would put it just above the tariff cut-off weight.  However, if the Chinese government defines empty weight as “manufacturer’s empty weight” which is the weight of solely the aircraft structure, the 737 MAX 8 will undoubtedly be subject to the proposed tariff. It is important to note that the tariff on aircraft is not likely to be implemented in the immediate future, but should it go into effect there would be significant consequences for both the Chinese and American aviation industries. The C919 would undoubtedly become more attractive to Chinese operators as the pricing versus the 737 MAX 8 would only become more competitive.  There are currently only 138 orders for the 737 MAX 8 from Chinese operators, but there are 1,079 737-800s currently operating in China that will need to be replaced at some point in the future.  Since Boeing would no longer be able to compete in this segment, COMAC and Airbus would undoubtedly look to fill this demand.  However, the 737-800 fleet in China is very young, with an average age of just under five years, so the tariffs would most likely be repealed once the fleet needs replacing in significant numbers.  The tariffs would also make it difficult in the short term for American operators to move used 737NGs, as the Chinese secondary market would effectively be blocked.  Should the tariff go into effect, both COMAC and Airbus could be winners, and the C919 program may get a much needed boost.

Looking Ahead

The C919 is a noble effort by the fledgling Chinese aviation industry. The aircraft is more than capable of serving Chinese airlines in their domestic operations, which is a sizeable and growing market. This combined with bargain pricing and Chinese government assistance may drive Chinese operators to the C919, cutting into a small yet noteworthy portion of both Boeing’s and Airbus’ Chinese business. Outside of China, the performance limitations of the aircraft will hinder the sale of the C919 and therefore COMAC does not currently pose a threat to the Boeing-Airbus duopoly. However, COMAC will certainly learn from its experience producing the C919 and will certainly produce more capable aircraft in the future. As a result, both Boeing and Airbus should take the Chinese aerospace industry seriously and implement strategies to counter their new competition.

Utilizing Alternative Collateral: Spare Parts

Alternative Collateral

In order to raise capital, many airlines issue debt or secured bonds backed by their aircraft and engines, but most airlines are sitting on another underutilized form of collateral: spare parts.  Spare parts are a widely-accepted form of collateral, but few airlines have used this often appreciating asset-to-issue debt.

There have been few instances of aircraft spare parts being used as collateral for secured debt in recent years, highlighting the underutilization of spare parts.  mba has found only US$1.1bn of outstanding debt tied to spare parts that has been publicly listed, which pales in comparison to the tens of billions of dollars of outstanding debt tied to aircraft and engines.  This excludes credit facilities that were undrawn as of December 2016.  It also excludes any privately-held airlines where financial information is not publically available and parts debt issued by Republic totaling US$139.7mn due to Republic’s bankruptcy and subsequent removal from the NYSE.  Cash-rich airlines have paid down debt in recent years, so there may be limited need to issue new debt, however due to the cyclical nature of the aviation industry, the time will come when airlines will need to issue debt once again.

Spare Part Classification and Condition Overview

There are three (3) main types of aircraft spares: rotable, repairable, and expendable parts.  Rotable items are parts that can be repeatedly rehabilitated to a fully serviceable condition over a period of time approximating the life of the flight equipment to which it is related.  Examples of rotable items include avionics, landing gear, and major engine accessories. Repairable items can be rehabilitated to a fully-serviceable condition over a period of time less than the life of the flight equipment to which it is related.  Examples of repairable items include engine blades, some tires, seats, and galleys.  Expendable items are parts for which no authorized repair procedure exists, and for which the cost of repair would exceed that of replacement.  Examples of expendable items include nuts, bolts and rivets. Rotable items are usually the most valuable items in any operator’s inventory, and although they may make up 10.0% of a particular inventory, they will normally make up over 90.0% of an inventory’s value.  On the other hand, expendable components make up a large portion of the inventory but have a smaller percentage of value.

Part condition plays a major role in the value of a particular component.  Spare parts in aviation use a rather unique set of condition descriptions.  The most common part conditions are: New, As Removed, Serviceable, Unserviceable, and Overhauled.  When a part is removed from an aircraft during a part-out process, that part is considered to be in “as removed” condition.  These parts do not have the necessary paperwork that will allow them to be put into use in an operator’s fleet, and therefore are considered by the market to be less valuable.

In order for a part to be considered “serviceable,” spare parts must be accompanied by certifying documents, such as an FAA 8130-3 or EASA Form One, prior to installation on an aircraft.  The most cost-effective method to achieve this certification is for an authorized repair station to conduct what is known as a “bench-check” to confirm the serviceability of a particular component.  Components that are determined to be “unserviceable” must be repaired or overhauled in order to receive a certifying document.  Overhauled components are components that have been disassembled and returned as close as possible to new specifications, and therefore command a higher price in the market than components that are determined to be serviceable.

Spare Part Valuations

A market-based approach is typically used to value spare parts, as values for spares are more volatile than aircraft and engine values.  Data points from a year ago may not tell an accurate story of the Current Market Value of a particular part due to market variations, which may occur more rapidly on a supply and demand basis in the spare parts market than the aircraft market.  A current snapshot of the market for each individual part number needs to be obtained at the time of valuation.  Values may then be adjusted based on the market availability and component condition to reach a Current Market Value for each line item in the stated condition.  One way to value components is on an individual component basis which assumes that each part in a particular inventory will be sold individually with no time restrictions for the sale.  In order to determine the value of an inventory that needed to be sold in its entirety within a specified time period, an Orderly Liquidation Value or Forced Liquidation Value should be provided for a specific “lot” of components or an entire inventory, creating another valuation basis for an appraisal.

An aircraft or engine that is in high demand will naturally have spare parts that are in high demand, and will be priced accordingly.  However, unlike aircraft, spare parts do not necessarily depreciate over time.  Spare parts that service a particular aircraft will depreciate at first as the aircraft platform enters service and supply of parts is predominantly provided by the manufacturer of the components at what many would consider “list prices.”  Then, as the secondary parts market becomes more active, the market value of components will usually appreciate modestly until the remainder of the platform’s production life.  Once production of a particular aircraft is ceased and a considerable number of aircraft remain in service, the market value may begin to appreciate at an even greater rate as part scarcity starts to increase and demand remains constant.  This typically drives the entrance of part-out companies in greater numbers which acquire and disassemble aircraft to service this market. This leads to a period of stability in value before entering a period of volatility in which values are directly correlated to the supply and demand ratio for the specific component.  The following graph illustrates the life-cycle of spare parts value.

Monetizing Spare Parts

Spare parts trade rather easily on the secondary market, as there is always a demand for parts to keep in-service aircraft flying.  There are several platforms on which sellers can market their parts including several online services such as ILS and Parts Base, where sellers can post the parts they are looking to liquidate.  When monetizing inventories, sellers looking to maximize yield typically list their spare parts on the market individually, yielding the highest value over a long period.  Those who own larger inventories that require monetization in shorter periods of time may require a ‘lot sale.’  Lot sales have lower yields than selling each part individually, but they have higher sale rates and allow for the sale of parts in greater numbers.  Another option for part sales is auctioning, during which the seller packages entire spare part inventories for liquidation. This alternative often results in the fastest turnaround for sale on the market, but provides the lowest yield overall.


*Backed by a team of five ISTAT certified appraisers, mba’s trusted valuation team offers a wide range of valuation services, including the valuation of alternative collateral and spare parts as defined in this article. For more information or questions, please email valuations@redbook.aero

Monetizing Slots, Gates and Routes

Slots, Gates and Routes – Monetizing Intangible Assets

Slots, Gates and Routes (SGR) are immensely valuable assets for airlines, referred to commonly as “intangible” assets for valuation and collateralization. For operators, SGR assets represent strategic long-term competitive advantages and their value helps to raise additional capital for airlines, predominantly based in North America. mba estimates that close to $8.0bn US of debt was outstanding as of December 2016 utilizing slots, gates and routes as collateral. Despite the numbers, large-scale collateralization of SGR to raise capital remains largely untapped in non-US markets.

The use of SGR as collateral for funding purposes relies primarily on lenders’ and investors’ confidence in the enforceability of the asset; concern is focused on such enforceability in the event of default, as well as maintaining contractually agreed-upon loan-to-value (LTV) ratios. Detailed in the contracts, an independent initial request to provide the appraised asset value serves the joint purposes of calculating initial LTV ratios and subsequent calculations of maintenance of these ratios.

SGR Defined – What Falls Into the Asset Class?

Slots

Generally speaking, the term airport slot covers the range of actions and access an operator may have at a given airport, including land and takeoff and use of related facilities on a schedule basis. The term slot is interchangeable with slot-pair as the use includes time scheduled to land and depart. The International Air Transport Association (IATA) defines an airport slot as “a permission given by a coordinator for a planned operation to use the full range of airport infrastructure necessary to arrive or depart at a Level 3 airport on a specific date and time.[1]” Airports are classified by IATA as a Level 1, Level 2 or Level 3 based on the capacity of the facilities and the demand for access or use. Level 1 airports’ capacity generally meet the demand at all times whereas a Level 3 airport’s demand for slots significantly exceeds the capacity at the airport and therefore slot allocation requires a coordinator out of necessity. Although most airports in the U.S. are categorized as ­Level 1 airports under the IATA Worldwide Slot Guidelines (WSG), the Federal Aviation Administration (FAA) has imposed Level 3 slot controls by rule at John F Kennedy International Airport (JFK), LaGuardia Airport (LGA), and Ronald Reagan Washington National Airport (DCA).


Routes

Routes are defined as the right to operate scheduled air service between specified airports. The route authority is governed by multilateral agreements between countries, and are subject to capacity restrictions at each airport and also between countries. In the United States, the Department of Transportation (DOT) processes requests by U.S. airlines for authority to serve foreign markets. If more carriers seek frequencies than are available, the DOT must allocate the frequencies among the U.S. carriers using comparative selection procedures.

A Brief Look at the Market

A vast majority of outstanding SGR secured debt consists of bank loans between airline and a lending bank. Although the use of slots, gates and routes as collateral in debt financing is common among large North American airlines, it still represents a minority share of total debt financing for these airlines, with the exception of Virgin Atlantic.


In December 2015, Virgin Atlantic used its slots at London Heathrow Airport (LHR) as collateral for a private placement bond, raising £225 million ($260 million US) of debt financing, the largest non-bank related debt financing arrangement with SGR as collateral, with proceeds used to finance new aircraft orders. In January 2017, Virgin Atlantic announced it had secured another £32 million ($40 million) of financing on the back off the same slot portfolio. The Virgin Atlantic deal represented the first, and (to this date) only, funding deal where slots outside of US airports were used as collateral in non-bank lending, although British Airways’ parent IAG previously attempted in 2012, but proved unsuccessful due to the timing issues, and that transaction’s  specific complexity.

In addition to providing an additional source of funding for airlines and thereby diversifying the funding base, the cost of SGR related debt is relatively beneficial compared with other common sources of aviation financing. The chart below depicts the average publicly disclosed interest rates on debt facilities secured by SGR collateral and the average LTV for the same facilities, in comparison to recent aircraft ABS and airline EETC transactions. On average, interest rates on SGR secured debt facilities are comparable to A-tranches in aircraft ABS and EETCs.


Regulatory Impact on SGR Assets

While investor confidence to enforceability plays a large role in arranging SGR debt financing, the regulatory environment in various jurisdictions often dictates the starting point for valuing SGR assets. Changes in regulations can have a significant impact on the value of these assets.

In the US, the Department of Justice (DOJ) can mandate divestitures when there are competition concerns as a result of mergers between airlines. Following their merger in 2013, US Airways and American divested a total of 17 slot pairs at LGA and 52 slot pairs at DCA to gain DOJ approval. Private auctions for these slots at LGA and DCA, respectively, were limited to Low-Cost Carriers. Ultimately, at DCA, Southwest Airlines won six pairs plus five pairs it was already leasing from American, while Virgin America won bids for six slot pairs. At DCA, Southwest Airlines won 28 pairs, JetBlue Airways won 12 pairs, plus eight they were already leasing, and Virgin America won four pairs.

The US Department of Transportation (DOT) also plays a role in the management of SGR. It granted antitrust immunity in 2016 for the proposed alliance agreements submitted by Delta Air Lines and Aeroméxico. This was on the condition that the carriers divest takeoff and landing slots to support 24 new daily transborder services from Mexico City and four new daily transborder services from New York JFK, to be operated by competing airlines. The American and Delta examples above illustrate the impact regulatory actions have on competitive environment and SGR values.

Beyond North America, regulation can, in addition to evaluating slots for competition, impact the distribution of trans-ocean routes. In December 2016, the DOT finalized its decision to award American Airlines route authority between Los Angeles and Beijing. Delta Airlines had also filed an application, however the DOT determined that American Airlines’ superior connectivity (resulting in a higher number of U.S. travelers benefitting from one-stop connections over Los Angeles) was significant enough of a factor to award the route to American.

Asset Enforceability and Transferability

As SGR is considered an intangible asset, establishing parties’ legal rights and generally market interests are together the center piece to demonstrate discernable value for the parties transacting, the relatively small number of completed sales transactions make benchmarking difficult, and attracting investment using these assets is complicated by lack of information. However, there are indicators of the inherent value, enforceability and transferability of the asset worth reviewing.

Although sales of SGR assets occur less frequently, several examples of slots and routes transactions are notable. The table below contains slot sales at London Heathrow Airport, LaGuardia Airport, and Ronald Reagan Washington National Airport over the past decade, their value being shown in the market demand.


Sales of routes occur less frequently than slots, however multiple transactions between 1982 and 1992 are informative to value and opportunity. Approximately $3.0bn worth of route transactions occurred during this period as shown in the following table. A majority of these sales were a result of bankruptcy proceedings.

The legal view of SGR collateral is equally up to benchmarking the asset value in the market, and the use of slots, gates and routes as collateral has been supported by several US courts. In the American Airlines bankruptcy case, the route authorities and gate leaseholds that had been used as collateral in certain of its lending agreements were deemed as valid. Ultimately, American Airlines prepaid these loans early and the creditors received full payout, with no impairment of their security interest. Another example where the validity of SGR assets was upheld in court is the case of Monarch versus Airport Coordination Limited. The court ruled that Monarch in fact had the right to its slots for the 2018 summer season at London Gatwick airport, despite having had its Air Operator Certificate revoked (see: How Monarch Monetized Gatwick Slots Post-Collapse). The right to sell an asset out of Bankruptcy as ruled by the court in the Monarch case provides further validity to the use of SGR assets as collateral.

Finally, even in instances where sales of SGR are prohibited by regulation and transferability of the asset cannot take place, there is inherent intangible value in the asset. This is because airlines can lease the asset to a partner airline rather than sell it in order to obtain long term rights to the slot. In fact, slot leasing is more common than slot sales as airlines prefer to retain the long term rights to the asset. Therefore, where sales are prohibited, it is possible to generate a return on the asset while maintaining long term ownership rights.

Conclusion

Large North American Airlines have successfully monetized their slots, gates and routes to raise financing. That said, SGR secured debt still represents a minority share of an airline’s overall debt funding and remains a relatively new concept among airlines outside of North America. The regulatory environment can have a significant impact on the value of SGR assets, as illustrated above. However, regulation tends to change infrequently and the long term nature of these assets means their value is less susceptible to short term fluctuations in the economic environment. Moreover, the validity of slots, gates, and routes as collateral has been upheld in several court cases predominantly in North America, but also more recently in the UK. While the Monarch ruling should improve investor confidence in SGR assets, large-scale monetization of slots, gates and routes outside of North America remains a significant source of untapped capital.

[1] https://www.hamburg-convention.com/en/hamburg/stories/iata-slots-conference

A Look at Aircraft Finance – Part I

The availability of capital to fund aircraft acquisitions is one of the critical support structures that allows for commercial aviation industry growth and prosperity. In an environment of low central bank interest rates and highly liquid markets, investors from around the world have been flocking to the aircraft finance sector. While the enthusiasm for the industry is welcomed and has provided capital for fleet renewal and growth, some lessons can be learned from the historical progression of commercial aircraft finance that lessors, operators, and investors would be wise to heed.

In this edition of mba’s insight series, we will look at the three major pillars of commercial aircraft finance, the relationship of operators and lessors to those pillars, and the past investment cycles seen in the industry. From this solid foundational understanding, we will explore the importance of accurate asset valuation and discern some lessons that can be garnered from the study of past investment patterns. Finally, we’ll apply those lessons to the future of aircraft finance, identify emerging trends, and look for areas where caution may be warranted.

The Three Pillars of Aircraft Finance

When airlines or leasing companies acquire new aircraft, closing the transaction on a cash basis only accounts for about one-quarter of aircraft deliveries. In 2016, cash was used in approximately 28.0% of the $122 billion spent on procuring commercial aircraft.[i] For airlines, in particular, there are drawbacks to acquiring aircraft using cash. The airline winds up assuming the depreciation of the aircraft and the capital outlay is often enough to give both internal accountants and investors significant pause. For leasing companies, the reasons not to use cash in a transaction are much the same; if interest rates are attractive enough, there may be financing avenues that are more economically advantageous. These less cash-intensive alternatives make up the three main pillars of commercial aircraft finance.

Bank Debt

Taking on bank debt was, until the advent of leasing and elaborate collateralization schemes, the primary method by which airlines (and later leasing companies) acquired commercial aircraft. On the surface, bank loans for aircraft look much like a mortgage on a home or commercial building; the bank supplies the upfront cost of acquiring the asset and is paid back by the operator over time with interest added.

While they may seem relatively simple, in reality, bank loans for commercial aircraft can be highly sophisticated financial instruments. There is often an upfront cost to the leasing company or airline; 15.0% of the amount of the transaction is a typical number, but this can vary depending on the value of the underlying asset and the creditworthiness of the entity purchasing the aircraft. Large commercial banks will often pool their resources, spreading the risk among a syndicate of different financial institutions to fund the aircraft acquisition deal. Bank loans can cover the purchase of a single aircraft, or many separate airframe purchases may be packaged together into portfolios worth hundreds of millions of dollars. These loans can be unsecured, or the value of the aircraft themselves may secure them.

Often banks provide loans to airlines or leasing companies on a short-term basis, with the expectation that the purchaser will refinance their purchase. Known as warehouse or bridge loans, these arrangements can involve either fixed or revolving lines of credit that allow the aircraft acquisition to proceed while other financing deals are put into place. Additionally, banks may provide pre-delivery financing to allow commercial aircraft purchasers to make the required payments on new aircraft as they are being built. These payments are often equal to an amount that is between 10.0% and 20.0% of the sale price.

Capital Markets

Banks represent a single source of capital with which to fund purchases. The downside of bank loans is the substantial risk to a financial institution’s balance sheet; they are exposed to the depreciation of the aircraft asset and the risk of operator insolvency in what is a historically highly-cyclical industry. The capital markets offer a significant reduction of risk for lenders, providing financing to the commercial aviation marketplace. By collateralizing the debt, the risk of the transaction is spread out among a large pool of investors. Additionally, leveraging bond markets for aviation financing represents a significant increase in the amount of available capital, creating competition and reducing overall lending costs across the landscape.

Access to investor funds come in three general varieties:

  • Unsecured bonds: These bonds are most typically used by leasing companies who require flexibility in terms of payment profile. While underlying physical assets do not back them, these products are nevertheless very popular. In 2017, approximately $4.85 billion in unsecured bonds were issued to commercial aircraft leasing companies.[ii]
  • Asset-Backed Securities (“ABS”): These securities are backed by the value of the aircraft themselves, and in the case of leasing companies, the value of the rental contracts. ABS’s are complex financial instruments that are organized into tranches of payment priority and risk. The highest tranches are paid first but at lower return rates than the lower tranches. ABS’s are increasingly becoming a popular method for aircraft lessors to tap the capital markets.
  • Enhanced Equipment Trust Certificates (“EETCs”): These instruments function in much the same way as ABSs and are based on the value of the aircraft assets. They are typically issued by a single airline to fund equipment purchases.

Export Credit Agencies (“ECAs”)

ECAs are private or quasi-governmental financial institutions that issue export financing. The reason that ECAs exist is the result of a relatively simple calculation; increasing exports is good for national economies. When a domestic company imports a product to a foreign country, that export comes with political and commercial risks not inherent to domestic transactions. ECAs may provide direct financing, intermediary loans, or interest rate equalization loans to encourage export activity. Direct financing notes for commercial aircraft are standardized financial instruments that are based on a maximum 12-year term.  Examples of ECAs include the U.S. Export-Import Bank of the United States (EXIM), the European Investment Bank (EIB), and the Export-Import Bank of China. Since their role is to provide capital for international sales, the availability of ECA funds is of particular concern to aircraft manufacturers.

A Brief History of Aircraft Finance Trends

Up until 2008

The business of investing in commercial aircraft is nearly as old as the airline business itself. Technological development has always outpaced the ability of operators to afford to purchase the latest and greatest technology or to renew their fleets as they reached the end of their useful lives. For most of commercial aviation’s history, bank loans have been the “coin of the realm” of the aircraft finance world; banks would make loans that were normally backed by the aircraft themselves. Airlines would eventually own the aircraft, having assumed the costs of purchase, financing, and depreciation throughout the life cycle of the assets.

Bank loans for aircraft purchases often did not provide operators with the flexibility they required to refleet (or shed airframes) in response to market demands. Additionally, outright aircraft purchases can encumber airline balance sheets with numbers that are unattractive to potential investors. To address the need for operator flexibility and to meet market demand, commercial aircraft manufacturers began leasing aircraft in 1968. This first boom in leasing was led by McDonnell Douglas and Boeing who were looking to move their DC-9s, 727s, and newly developed wide-body products.

The intrinsic value of aircraft assets and the investment opportunity presented by providing capital to airlines operating on razor-thin margins was realized by corporate entities outside of traditional aviation circles. In 1967, GECAS wrote its first commercial aircraft lease to Allegheny Airlines. In the mid-1980s, amid an environment of falling interest rates and a commensurate plummeting of Treasury bill yields, institutional investors began to look for stable instruments that offered superior returns. They found those opportunities in the aircraft leasing market. Non-aviation companies as diverse as Xerox, IBM, and General Motors—even Greyhound—held lease notes on a substantial percentage of the world airline fleet.  On the back of this private capital, the total value of large commercial aircraft deliveries increased from less than $20 billion in 1982 to more than $50 billion in 1990.[iii]

With the growth in aircraft leasing by both dedicated aviation financing companies and others, new investment instruments were conceived to handle demand. The early 2000s saw an increase in more complex ABS and EETC-type products and increased competition in the financing space. After the shock of the 9/11 attacks, the commercial aviation industry seemed to be in a phase of solid recovery. There was abundant competition to write loans for new aircraft around the world. An AIN article in December 2007 quoted an anonymous lender who said, “I’ve seen some competition provide 100-percent financing on old aircraft, creating loans that were underwater from day one.”[iv] The market was overheated.

It is essential to pause for a moment to consider the importance of aircraft valuation to understand historical trends in aircraft finance. Most of the instruments (secured bonds, bank loans, ABSs, and EETCs) used to access capital for aircraft purchases are based on the value of the underlying assets themselves. In the case of the airlines, the market value of the aircraft is the operative value. For leasing company purchases, both the value of the aircraft and the rental contracts must be considered. Any historical evaluation of finance trends must include a careful assessment of aircraft valuations over time. The value of any of these transactions to the investment community is directly proportionate to the value of the assets which underlie those arrangements.

The 2006-2007 financial crisis to the present

The aircraft lending market was not the only overheated economic sector. It is now well-known that, in 2006, U.S. real estate values crashed as a result of excessive sub-prime lending. After years of easy money based on mortgage-backed investment instruments and foreign investment, portfolio values were reduced to dust virtually overnight. Liquidity in the market dried up almost entirely. There was virtually no money in the capital markets for lessors and airlines to borrow for aircraft acquisitions.

After the crash, the value of aircraft—and thus the value of aircraft based investments—took a similar hit. While the overall reduction in aircraft market values were not as dramatic as what happened to the stock market, they were negatively impacted to a degree that was palpable to prospective investors. Those institutional investors who had just had their “hair singed” by the worst economic crisis since the Great Depression were in little mood to get burned again. The anemic economic environment led to massive reductions in consumer spending, forcing airlines to slash the number of available seat miles (“ASMs”) in the marketplace and right-size their fleets.

In July of 2008, before the long-term impacts of the financial crisis were fully evident in the aviation industry, U.S. airlines flew more than 93 million ASMs system-wide. As the airlines aggressively cut capacity and parked airframes, ASMs fell to a low of 68.5 million in February 2010. ASMs did not recover to 2008 levels until July of 2011.


One of the major financing avenues that the commercial aircraft industry turned to was ECAs.  These quasi-governmental financial institutions stepped in to provide critical funding for aircraft manufacturers to export their products overseas, giving lessors and operators around the globe access to desperately needed capital to right-size their fleet mixes. By 2011, ECAs were the source of a full third of all commercial aircraft finance capital.[v]With the dramatic reduction in liquidity in the market, aircraft buyers, lessors, and manufacturers were forced to turn to financing systems outside of the capital markets to fund purchases of aircraft. Even as ASMs were reduced, newer and more fuel-efficient aircraft were making their way into airline fleets. Aircraft type shifts were particularly apparent in the regional airline sector; as mainline fleets mothballed inefficient older aircraft, regional airlines saw deliveries of larger and newer aircraft (the Embraer E-170 and E-175 were particularly notable).

As time passed since the shock of the financial crisis and world markets stabilized, the aircraft financing landscape underwent changes that rebalanced the capital sourcing mix. To spur consumer spending and bolster their economies, central banks around the globe slashed interest rates following the crisis of 2006-2007. These rates fell to—and remain—near historic lows. Those low rates, coupled with astounding industry growth and record airline profits, made both bank loans and capital markets plentiful sources of aircraft finance capital once again. The same low interest rates brought investors looking for better bond yields back to the market, adding more available capital to the mix. The amount that ECAs contributed to the total financing picture was impacted to the greatest degree. In 2011, 33.0% of aircraft financing was provided by ECA institutions. That percentage fell off precipitously in 2014, and by 2017 ECAs only provided 4.0% of the $122 billion in commercial aircraft capital.[vi]

Discerning patterns in investment from the past

Based on our look at the history of aircraft finance trends, it is possible to come to a few general conclusions.

  1. Valuation is critically important. The overall value of nearly all of the available financing instruments to both the financial institutions and their investors is predicated on the value of the underlying assets. In most cases, these are the aircraft themselves.
  2. Aircraft values, and thus the value of any investment instrument predicated on them, tend to track with GDP. This makes practical sense; as GDP falls, so too does consumer spending. Less consumer spending leads to less money entering capital markets. Airline bottom lines suffer directly as well. In poor economic conditions, discretionary travel spending tends to fall off. In the financial crisis of 2006-2007, aircraft values suffered—and remained somewhat flat for a period afterward—as airlines “right-sized” their fleets to the demand.
  3. Low interest rates tend to stimulate both bank loan and capital market financing (ABS/EETC/secured bonds) activity in the commercial aviation finance space. This applies to both lessors and operators; lessors have become especially active, as the airlines have learned that leasing aircraft allows for increased flexibility and attractive balance sheet benefits.
  4. ECA is an option, but not preferred in the face of low interest rates and highly-liquid capital markets. The standardized terms of these credits are often inferior to bank loans and the capital markets, making them an unattractive “last resort” option for many operators and lessors.
  5. The market is cyclical, and recognition of trends tends to lag behind reality. As we saw in the run-up to the financial crisis, when loans were being written for aircraft at a loss, unbridled enthusiasm for an asset class can create so much competition in the marketplace that financial institutions write notes that, on later examination, prove to be less than worthwhile.

Where is aircraft finance headed?

The commercial aviation finance industry is complicated, but by applying the lessons learned about the evolution of the aircraft financing sector and how investment patterns have changed in response to external events, some reasonable predictions can be made regarding the future. When projected industry growth, anticipated aircraft orders, interest rates, and levels of current investment are considered against historical data, clear directional indicators begin to emerge.

We are currently in a period of growth within the capital markets. Even as the airlines and lessors took advantage of greater bank loan availability and deleveraged risk in 2017, the capital markets sector is poised for continued growth in 2018 and beyond. Lessors, who typically require large amounts of capital to fund large purchase orders from commercial aircraft manufacturers, can be expected to continue to utilize the ABS and other bond-related instruments that have proven to be advantageous for them.

The overall growth of the capital markets and higher availability of bank loans is being driven from both a demand and a money-supply perspective. Demand for commercial aircraft continues to be strong and is anticipated to remain so for an extended period to come. In the next 20 years, it is expected that more than 41,000 new airframes will need to be delivered. This number will be driven by not only fleet replacement as airlines look to take advantage of more fuel-efficient designs, but also by traffic growth. The demand is particularly strong in Asia, which will account for more than 16,000 of these deliveries.[vii]

Even as interest rates have begun to climb slightly, they remain near historical lows. That fact has driven more lenders and investors looking for superior returns into the commercial aircraft finance space, increasing the overall supply of available capital in the market. New entrants have been primarily institutional investors in Asia who are looking for relatively stable instruments to grow their portfolios predictably.


Low interest rates and abundant capital will likely lead to a growth in the role that bank loans play in aircraft finance as well. As commercial banks in Eastern Asia and Australia have entered the space, competition has begun to increase among financial institutions to write loans. The competitive environment has suppressed lending costs for lessors and operators, ensuring bank loans will remain an attractive financing option.

Airlines and lessors have recognized the benefits of bank loans and the capital markets. The aircraft finance picture today is one that is relatively balanced with cash, loans, and ABS/EETC instruments accounting for about 90.0% of capital sourcing. Strong, liquid markets, low borrowing costs, and low interest rates have relegated ECAs to a fairly minor role in commercial aircraft finance. The percentage of capital sourced from ECAs can be expected to remain in the single digits into 2018 and beyond.

Some cautionary signs point to potential issues on the horizon. The influx of new lenders and institutional investors creates greater competition in the aircraft finance space. That is a good thing for lessors and operators, as it continues to allow them to access capital on desirable terms. However, as was seen before the 2006-2007 financial crisis, exuberance can disguise warnings that the market is overheated. That is why accurate valuation is essential; it is the value of the assets underlying an investment (whether it be a bank loan, an ABS, or an EETC) that determines its ultimate worth, not transitory movements of the market.

Interest rates creeping in an upward direction add another cautionary data point to the aircraft finance picture. Airlines, in particular, have demonstrated a strong willingness to aggressively control both capacity and debt. As interest rates move higher, history shows that consumer spending tends to fall. Reductions in consumer spending tend to result in fewer revenue passenger miles being flown for discretionary travel. Since a large percentage of the world airline fleet is leased, operators are well-positioned to absorb fluctuations in demand; leasing allows them the flexibility to adjust the number of seats in the market in a reasonably short period. If demand were to be substantially impacted by unexpected events, aircraft market values could be negatively impacted.

[i] Hammond, Rich. Aircraft Finance. Boeing , 2017.

[ii] “Aircraft leasing company bond issues 2017.” Aircraft Investor, www.aircraftinvestor.com/articles/aviation-finance-data/aircraft-leasing-company-bond-issues-2017/

[iii] Richard Aboulafia | Aviation Week & Space Technology. “Opinion: Short-Term Memories Can Lead To Big Miscalculations.” Opinion: Short-Term Memories Can Lead To Big Miscalculations | Master the Supply Chain content from Aviation Week, aviationweek.com/master-supply-chain/opinion-short-term-memories-can-lead-big-miscalculations.

[iv] Padfield, R. Randall. “Aviation Finance.” Aviation International News, 3 Dec. 2007, www.ainonline.com/aviation-news/aviation-international-news/2007-12-03/aviation-finance.

[v] Hammond, Rich. Aircraft Finance. Boeing , 2017.

[vi] Boeing. Current Aircraft Finance Market Outlook. Boeing, 2018.

[vii] Boeing. Current Market Outlook 2017-2036. Boeing. 16 Jun. 2017.

mba’s STAR Fleet Analyzes Aviation in South Korea

South Korea Aviation Market Snapshot

Powered by mba’s REDBOOK STAR Fleet

Leading up to the 2nd Annual Korea Airfinance Conference, mba generated a brief analysis of the Aviation Market in South Korea using data from REDBOOK’s recently launched STAR Fleet.

Here are some of the insights derived from the report:

  • Currently 396 aircraft are operated by South Korean carriers
  • Half of all aircraft operated in South Korea are leased
  • 75% of the country’s fleet is operated by the top three carriers
  • In 2017, there were 368K frequencies and 76.9M seats (each way) recorded in South Korea